Saturday, 29 June 2013

Weekend update

No comments :
Nasdaq Composite presents itself with clear support and resistance lines. The green resistance hit at the top was a very accurate turning point. The recent bottom coincided with the orange and blue support lines that makes it a strong medium term bottom. The next hit on the blue support will be the 4th and that's the one to be cautious about for a break down. In addition, the recent top's RSI indicates that a new top may have strong negative divergence on the weekly and the daily charts similar to the 2010 top which would be a great shorting opportunity. Until then, I consider this as the last wave up with the target of 3537 and the rising support currently is at 3332.
Gold bounced right at the bottom of the green and orange channels. The ellipses locate the pillars of these two strong channels and until they broke up we cannot expect the widely anticipated bull market to continue. The red and blue support lines are shown in my previous gold posts so I will not show them again.

Aussie dollar's red declining channel is still in charge. There is positive divergence on the RSI and it just hit the blue support line which makes it also a candidate for a triple bottom. There is very strong positive divergence on daily charts as well. 
The weekly Aussie chart indicates a possible reversal here with the red hypothetical rising channel support. In addition, last time RSI was this oversold was at the long term bottom in 2008 shown in blue. Furthermore, the shorts had reached a new record before last week. That record was probably broken again in this last leg down. Concluding, the reversal may be very near.
Last but not least is the British pound getting prepared for a bounce towards 1.58 but it has to break up the exhausted green declining channel first.

Friday, 28 June 2013

Was it a genuine support break?

No comments :
As I was telling in my previous posts, I don't think the recent break of the support lines on all indices, commodities and FX pairs was a genuine one with natural market forces. Ben's speech caused a selling spree which broke the channels prematurely but the markets should ultimately reach their targets no matter what. We can see this on WTI below. I showed the "Ben effect" with red ellipse. If the recent break of the red support line was a genuine one, the retest of it would have caused at least a pause or a bounce back down. But... there are no signs of a pause and it is going straight through it. I expect it will reach its ultimate target which is the orange triangle support that I showed here.
Last time I posted on Natgas here, it was breaking up the red strong resistance. After a good rise now it is testing that broken resistance and it may well play as support here. I think it is a good level to join the natural gas trade. Hope it helps.

Thursday, 27 June 2013

Still bullish around here

No comments :
Russell is looking very bullish here. It hit an internal resistance of the red rising channel yesterday which is the third line from the bottom band. I expect a hit on the second line and a hard bounce to break through to new highs. Stop loss of this channel is around 939 today. 
I haven't posted on FTSE very often but I felt obliged to show the strong orange resistance today that broke down during the recent wild decline. I expect a hit and bounce back down initially. It may go back and break it up later as I showed with the blue scenario but it is a good shorting opportunity at the moment. The red scenario which is -considering the oversold conditions- unlikely in the short term calls for a deeper drop towards the blue support. The breaking of the blue resistance back in December 2012 was a text book break out with a very tight stop loss control. 
On GBP, the green declining channel is still in charge and there may be a final hit on the lower band before a break up. Until this channel is broken up long positions should be on hold.
In my last posts on Gold here and here, I first gave a warning and then delivered terrible news for gold bugs. That is still valid until we touch the blue support. It has dropped $150 since the red support is broken. The sheer selling power has left no chance for any reasonable bounce. I'm not sure at which level we will hit the blue support but I will be watching it very carefully. Around 1100-1150 would be a probable hit by looking at it.
The normal scale Gold chart shows the orange declining channel with clear internal resistance lines. We have just hit one internal resistance today. Given the extreme oversold conditions there may be a relief rally that would give a breathing chance to the unfortunate bulls. Hope it helps.

Wednesday, 26 June 2013

Bears not so fast until Russell tells you so

No comments :
I tweaked my RUT channel from my previous post. I was a bit uncomfortable that the upper band of that channel was not hit at the recent top, i.e. 1007. This is the key with channels; if you are not accurate with the bands, just when you think the support is broken it may bounce hardly and doesn't look back. Back to RUT, the actual channel may be this red one below in which the recent top hits the upper band. The implications of this is important: This makes the RUT channel support relatively young with only 2 hits on the lower band. With this in mind, the upper band needs another hit around 1050-1060 which is a long shot from here. I doubt it will happen but it is always a possibility. Unless we make a lower low today or tomorrow and break this channel, I expect we go higher fast.
S&P has clearly broken the red support after Ben's speech but it is an event driven break. This is the reason I'm very skeptical about this recent decline and I expect a jump very soon towards 1635-40 area which is in line with my RUT projection. However, the blue channel can be a tough resistance against higher prices particularly the area I showed with the ellipse. We will see.
The steep green channel I plotted in my last post on GBP is broken up but there is one more declining channel with a smaller slope that I showed with green again. This channel looks exhausted with 3 hits on the upper band so I expect it to be broken and we may go back to 1.57 area soon. Hope it helps.

Sunday, 23 June 2013

Start of the week charts

No comments :
The action after Ben's speech caused volatility and false breakouts in almost all indices. S&P's false breakout is shown with the grey line and the blue ellipse area. It was a bullish breakout but things changed and heavy selling came following his speech which also caused the red support to break. It was possible to catch the probable bounce level with a channel shot which I showed with orange channel. Ideally, the bounce should take us to the red broken support and then back to the orange channel's lower band. But since this recent move caused a lot of gaps to be filled, we may even break into the red support again. Until this orange channel is broken downwards I do not expect further weakness.
Russell's red channel support indicated the bounce level very clearly and that's exactly where it bounced. The false bullish breakout is shown again with the blue ellipse. As I was saying last week, RUT is the most bullish looking index to the eye at the moment.
The ETF VIXS I posted here gave the first alarm before FED meeting. The bullish breakout advanced last week and we have a clear breakout now. We may retrace and hit the red resistance again which would give a better entry point for my bearish fellas. The profit potential as you can see from the chart is enormous.
British pound broke down the red rising channel as a response to Ben's speech. There was a follow through as prices continued their decline but I'm skeptical about the recent USD strength. There is a green steep declining channel in the picture but if that breaks up we may see the 1.57-1.58 area once again. Otherwise, this looks very bearish and shorts are in favour as long as the green channel is in charge.
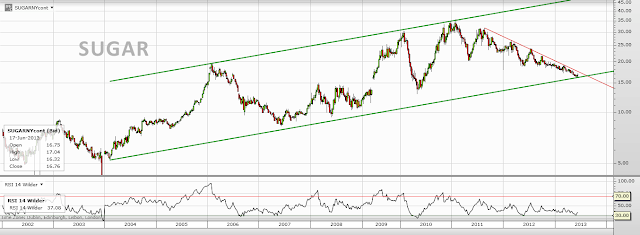
I have been watching the agricultural commodities for a while, particularly coffee, sugar, and cotton. All of them including the DBA index which I posted here look extremely depressed. For the ones who do not trade these instruments via futures or CFDs, I suggest you buy small amounts of ETFs following these commodities. I think there is a new bullish wave around the corner as I read a lot of hedge funds are exiting agriculturals all together due to heavy losses in the last two years.

I would like to mention sugar first which shows that the price action is at a very important junction here. The multiyear green channel's lower band was hit either last week or will be hit next week which makes it an ideal entry point with tight stop loss control. The red resistance is very strong and once broken it may unleash much higher prices from here.

Cotton's 2 year red declining channel is broken but being retested as the prices were right at the broken support last Friday. The blue consolidation channel may be a resistance to higher prices for a while but I expect it to break upwards ultimately. Hope it helps.

Thursday, 20 June 2013

Terrible news for gold bugs

No comments :
Ben's speech caused some volatility and during volatile markets a lot of gaps occur. These gaps get filled sooner than later. These event related volatilities are not good for channels because they disrupt the natural trading behaviours and tend to break the channels prematurely. Anyway, that's something everyone has to live with. 

Following Ben's speech, gold broke the substantial red support line it has been trying to break since the bear market started. The logarithmic chart shows a clear break and the next long term support on the horizon is the blue line now.
Until that blue line is hit we have a well established orange channel with clear inner resistance and support lines. The second bad news is the broken red declining channel on the fourth hit, the golden hit. I think orange channel will be our guide during this decline. The RSI looks oversold and there is strong positive divergence. An inner support is just hit so we may expect a bounce here. Any hit on the upper band of the orange channel is a good shorting opportunity.
The red channel of the Aussie dollar was not broken up yesterday. It bounced back down from the upper band right after Ben's speech. I don't know how he manages this. :)
The bad news for the Aussie dollar is that the green support from back in 2009-2010 is now broken. However, the chart indicates that these levels are loaded with supports shown with blue area and it may take some time for the Aussie to break all these levels. Considering the massive positive divergence on RSI, deeply oversold conditions, the blue support area, and the hit at the lower band of the red channel, a bounce may come quite soon.
Last but not least is the S&P. The red support was hit for the sixth time and broke down as I was writing this post. Good luck shorting. Hope it helps.

Wednesday, 19 June 2013

The case with the channels

No comments :
There is no flawless method to markets and charting with channels is not an exception. There are some instruments which can be resolved and traded quite accurately with channels. British pound is one of them. You can make very accurate shots on gbp with tight stop loss control if you practice enough with channels. However, with Aussie dollar or Euro one has to give some flexibility to the channel bands. One example just happened in the last two days. In my last post on Aussie I plotted the channel with the magnet function of the charting tool which draws the lines on the exact highs and lows of the candle sticks I choose. The recent action showed that I should have left some leeway on my channels. Below is how it should have looked like. The blue ellipses show the small violations of the red channel but none closes below or above the channel. Prices are testing the upper band once more today. I'm looking for a close above that band.
British pound on the other hand shows very high accuracy with channels. I can't help but think that if someone ever finds the way to mathematically prove why and how these channels occur, he will be the wealthiest person on the planet. Cable's blue channel was very accurate. The red channel with a smaller slope gave a long entry point in yesterday's post with a sniper accuracy. The red channel will give a good short or long entry chance whichever way it breaks. Don't forget the mighty orange resistance from my post here
S&P looks more and more bullish here. It broke the orange declining bull flag. The blue resistance line may be a bit of drag for bulls for a while. Unless the red support is hit once more -one more hit most probably will knock it down- I'm still bullish from here.
Russell 2000, as from my previous post, still looks stronger compared to his big brother. Not only it broke up the blue bull flag but also the orange rectangle both on the fourth golden hit. This can be a good long entry with a stop loss inside these two channels. Hope it helps.

Monday, 17 June 2013

Some forex, gold and 2 ETFs

No comments :
British pound tried hard to break into the blue rising channel but failed today. The red hypothetical channel needs a hit and bounce to confirm.
Euro is in a solid uptrend shown in orange. It is consolidating now and any hit on the lower band is good long opportunity.
I have no updates on AUD as there is not much change since my last post. However, I can add that AUD shorts hit a new record recently which is in parallel with my long scenario. Dollar index channel in red is still in tact but Euro's uptrend is worrying for dollar's bullish case.
Gold is looking very weak here. I shamelessly stole the red support line from Jack at channelsandpatterns. That support has five hits until today which I showed in the second chart. The sixth one is just around the corner. If that support fails we can expect a big drop from here as a continuation of this major correction. The blue support may be the next stop for gold but that's still too far to think right now.
I do not post on ETFs but there are two long candidates here that hit the eye. The first one is VIXS which is a leveraged ETF connected to VIX. It broke up the resistance coming from 2011. This may be the start of something big. Although I posted bullish charts on S&P and RUT recently, VIXS chart tells me that complacency is fading away in the stock markets. Just sayin...
The second ETF is DBA which follows the DB agricultural index. There is a declining but very exhausted channel with positive divergences in many time frames. Worth a watch for a long position when it breaks up. Hope it helps.

Saturday, 15 June 2013

Weekend update

No comments :
I'm in the Far East away from home. My comfortable access to charts may be limited for the next 10 days. Starting with S&P, the channels are telling me that bull trend since November is getting weaker. There has been five hits on the red support. I have written in my previous posts that the golden touch is the fourth one but if that's not broken the sixth is the one to watch carefully. The stronger the support the faster it will drop once it breaks. Five hits makes it a very strong support. The orange channel still looks like a bull flag unless we hit the red support once more.
RUT looks bullish with only two hits on the red support. I usually do not count the multiple hits in April individually. There is only two hits at the upper band too but I doubt there will be another one if the S&P breaks down its own support. The blue declining channel's slope is very low which makes my bull flag opinion stronger.
British pound broke down the steep blue channel from my last post but now retesting the support. Usually these sort of steep channels break down but form an internal channel to hit their ultimate target. The red hypothetical channel can be a candidate to hit the broken 4 year orange support line.
Aussie broke up the red channel from my last post and now retesting the resistance for the second time. It may intrude a bit into the channel but to me this red channel is broken and a rising channel will be established soon. I would be surprised if the prices will come below 0.9380 before rising to at least 1.020.
WTI broke the red resistance. I expect higher prices towards the triangle resistance at 102 from my previous WTI post which is shown in orange.
It's been a while since I have posted on Coffee. I was expecting a bullish channel to start after breaking up the red declining channel. Despite weekly and daily positive divergences and a broken resistance, the prices kept on declining. The red channel's broken resistance have been tested 3 times with the last one two days ago. It looks deeply oversold and blue inner channel's support was also hit yesterday. I expect a bounce from here but a tight stop loss is not possible in my view. Maybe a small position with an ETF is a better way to trade coffee. 

Wednesday, 12 June 2013

GBP, AUD and DXY update

No comments :
British pound is still loyal to the blue channel. The next hit on the support will be the fourth one and that's the one to be cautious about. It is still trying to break into the red channel's previous broken support. If that happens, the next target is the 4 year broken orange support around 1.58. 
Dollar index's perfect red channel is still in charge. The price is at the support of an inner resistance line and support of a hypothetical blue rising channel. Another hit at the lower band of the red channel would be a good level to go long.
I like the Aussie dollar here. The prices have bounced strongly since my previous post. I had given the orange resistance and green support from 2011 as a turning point. There was a fake breakout below the orange resistance yesterday and I reckon a lot of stop losses were hit right there which is the cause of this recent bounce. After the red declining channel is broken I will be looking for a new rising channel to be established. In case the prices fall below 0.9380 again, that would be a big game changer for all markets. I marked that important support in the second chart. Hope it helps.

Monday, 10 June 2013

GBP and AUD update

No comments :
British pound seems to have established the blue rising channel since my last post here. The green support is still in charge and the orange resistance from the 4 year is the ultimate target of this recent action.
Aussie dollar presents itself with a long opportunity from here. The red declining channel looks exhausted with positive divergences on daily and 4 hour chart as below. The orange support is playing a role here as well. The most important point here is perhaps the low which was made back in October 2011 at 0.9386 shown in green. We will see if this will be a turning point upwards. The safer option is to wait until the red channel is broken with conviction. Hope it helps.