Wednesday 31 July 2013

Day of false breakouts

No comments :
Today was interesting for gold, euro and spx charts. They all somehow showed false breakouts, i.e. broke the supports/resistances but then resolved to the other side. When this happens, since most traders are expecting the same thing after the breakout, the reverse action is very brutal as all the stop losses are hit. Take a look particularly at the gold and euro charts. These happened before the FED meeting.

Monday 29 July 2013

Sweet sugar

2 comments :
Today's post has to focus on sugar of course. I called for a bottom on sugar in my last post here, even called it the Goldman bottom. Will it be the case? Time will tell but it sure looks very bullish right now. If this is a probability game, the trend reversal is very probable here. Looking at the weekly chart in that post, the ultimate target is cough, ehm 55-60. Even if we do not reach there I expect a rise up to at least 30 in the next 6 months.

Saturday 27 July 2013

Weekend post

No comments :
I focus on Russell 2000 this weekend. I added one short term chart on SPX as well. Have a great weekend. 

Thursday 25 July 2013

Market is always right

No comments :
I made an "early" post today and left off for drinks with friends. It turns out that it was really too early to talk. I came back to see that, again, everything has gone up but dollar. My stop on Cable was hit. Aussie has made a come back. Is it the start of the massive Aussie rally? We will see. Here are the updated charts:

SPX, Euro and Cable

No comments :

Wednesday 24 July 2013

SP500, Gold, Cable and Aussie

No comments :

Goldman bottom on sugar and coffee?

2 comments :
Goldman announced that they are cutting their forecast on coffee and sugar prices. Whereas I think we are very close or perhaps already made a major bottom. Can it be that GS is accumulating them just after their announcements without bidding them higher because investors listening to their announcements would be selling aggressively? Am I too bad for thinking this? :)
Sugar's descending contracting triangle is unmissable combined with a positive divergence. The 10 year hypothetical blue channel has to deliver a bottom somewhere here or maybe it already had. We will see. All I want to see is a break up of the red triangle. Perhaps in a couple of months we can call this the Goldman bottom!
Coffee has been developing a double decker declining red channel since 2011. We have already hit the bottom of it and bounced back up. I would like to see a close above the green resistance coming from 2011 highs to be sure that the bottom is made.
Aussie dollar's short term resistances are very clear and we are testing that orange resistance again today. In case the blue ascending channel breaks down we may test the red channel's support again or even a new dip may be in the picture.
Aussie dollar and Gold is quite correlated since 2008 bottom. Despite some lags and leads, there is a tandem action between them. Since I'm expecting one more dip on gold, Aussie dollar may do the same in the next weeks. If the orange resistance breaks up, it will be extremely bullish though. So I'm bullish on Aussie with some caution.
Last but not least is the S&P. Not much action today so I held it back. The orange triangle seems to be breaking down. The blue rising channel can give good long opportunity with some tight stop loss control. Hope it helps.

Saturday 20 July 2013

Weekend post

11 comments :
While equities are grinding higher, I wanted to present some predictions on the approaching major top and cautions from other bloggers. Now that we have made a new high, the negative divergence on RSI is evident that is similar to the 2011 top. Back in 2011, maximum RSI coincided with 1344 on S&P. The negative divergence top was at 1375. Between them were 31 points or 2.2% from 1344. Coming back to today, the same calculation would take us from May top of 1687 with a 2.2% rise to 1724. Of course I'm not saying the same thing will happen here. All I'm saying is that this number is in parallel with my channels predictions and the target wouldn't be too far from 1724 if this negative divergence delivers a major top. Below you will find the charts supporting this target.
Two charts from one of the other blogger sites I visit presented very alarming charts on debt margin levels. An analogy of the markets between 2003 to 2008 and 2009 to 2013 has surprisingly similar characteristics.
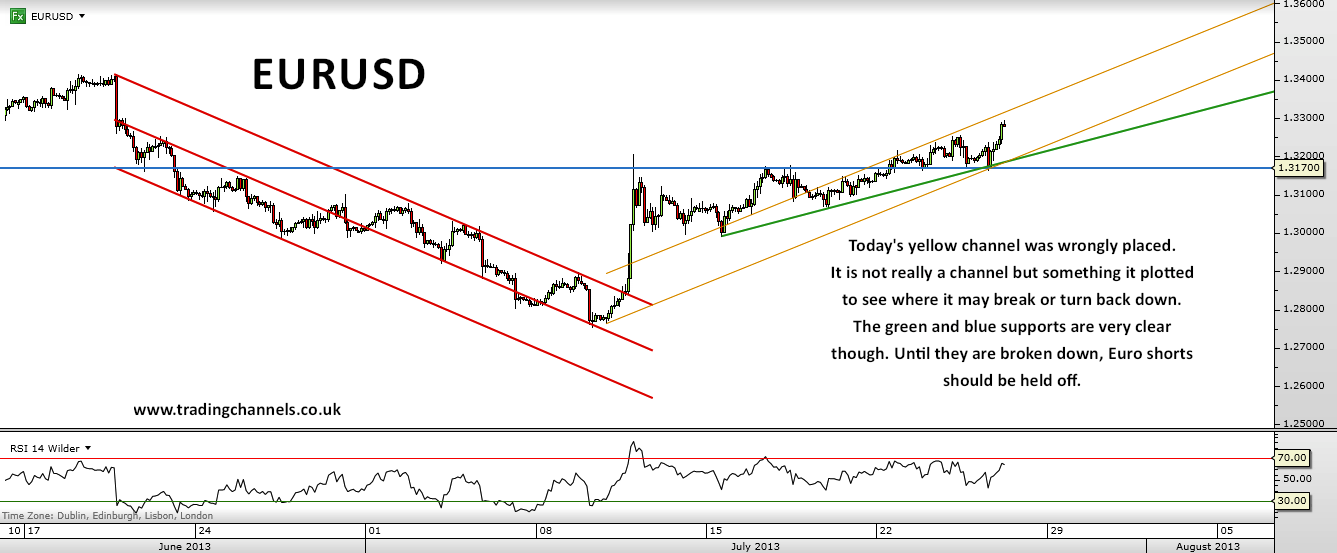
Euro's long term support has held at the recent bottom. This long term chart and the closer look shows that as long as this red support is held, the long waited dollar rally will not start. The green sideways channel is in charge here.
Cable's long term broken blue support is calling for another hit. I have seen this kind of broken supports acting like magnets. The green declining channel is in charge but its slope is too low to take us towards 1.35-1.40 levels soon. The positive divergence on the weekly RSI delivered this recent bounce. Unless we revisit the recent lows around 1.4830, I expect a strong rally to 1.59-1.60.