S&P500 weekly chart shows the 4 year perfect blue channel and recent action proves that the market "wants" to hit that upper band once more which would be the 4th touch. The extreme overbought condition which resembles the top in 2011 will be a big resistance against this breathless rise.
The short term picture is perhaps a guide to us to see how we may reach 1700. Now that the orange channel is broken upwards, the green channel is in charge but even that one's upper band is hit right now. We may consolidate to hit the lower band of the green channel to take us up to 1700 to make the golden hit on the blue channel.
The 4 year perfect channel in red on DOW30 indicates that another hit on the upper band is in the picture now. It looks massively overbought in RSI similar to 2011 top from where prices turned down and corrected by as much as 20%. However, I think we are very much in an euphoric period where any price looks cheap to the masses. It wouldn't shock anyone anymore, if it goes up another 1000 points from here.
Looking at the short term picture, the green channel is not a perfect one due to the blue circled area which was a news related action. However, the upper band hits shown by green arrows tell that this channel can be taken seriously. The fourth hit is just around the corner and it may well turn down from there to hit the lower band which will be a good spot to go long again.
The charts on gold are quite clear from every point of view. The 2 year chart shows the blue larger down trend which will be hit very soon again. The green steeper channel shows the last leg of the decline and I think this one will be in charge for quite a while. Another hit on the upper band would be a great selling opportunity.
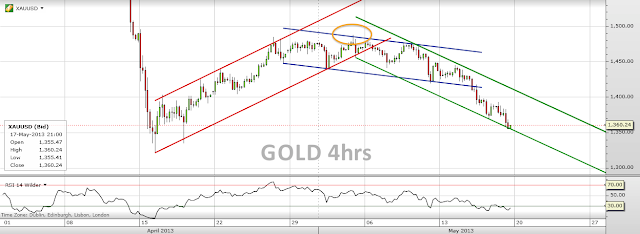
The short term chart on gold shows how the recent correction played out within the recent large decline. The rising red channel, the blue channel within the topping action, which for a while looked like a bull flag, and now the decline in the green channel are very clear signs that lower prices are here to stay. Also note that on all 3 channels the reference point is the top shown in orange ellipse. No matter what the gold bugs scream at you, the prices say the last word. Hope it helps.
This blog is a free service since the beginning. If this site has contributed to your trading/investing style in any way and you feel generous today, there are two donation buttons on the left side. Thanks for supporting this site by turning off your ad-block software and visiting the adverts.


No comments :
Post a Comment